View of Cheverny, 41 — real-estate investment analysis Wikimedia Commons CC BY-SA
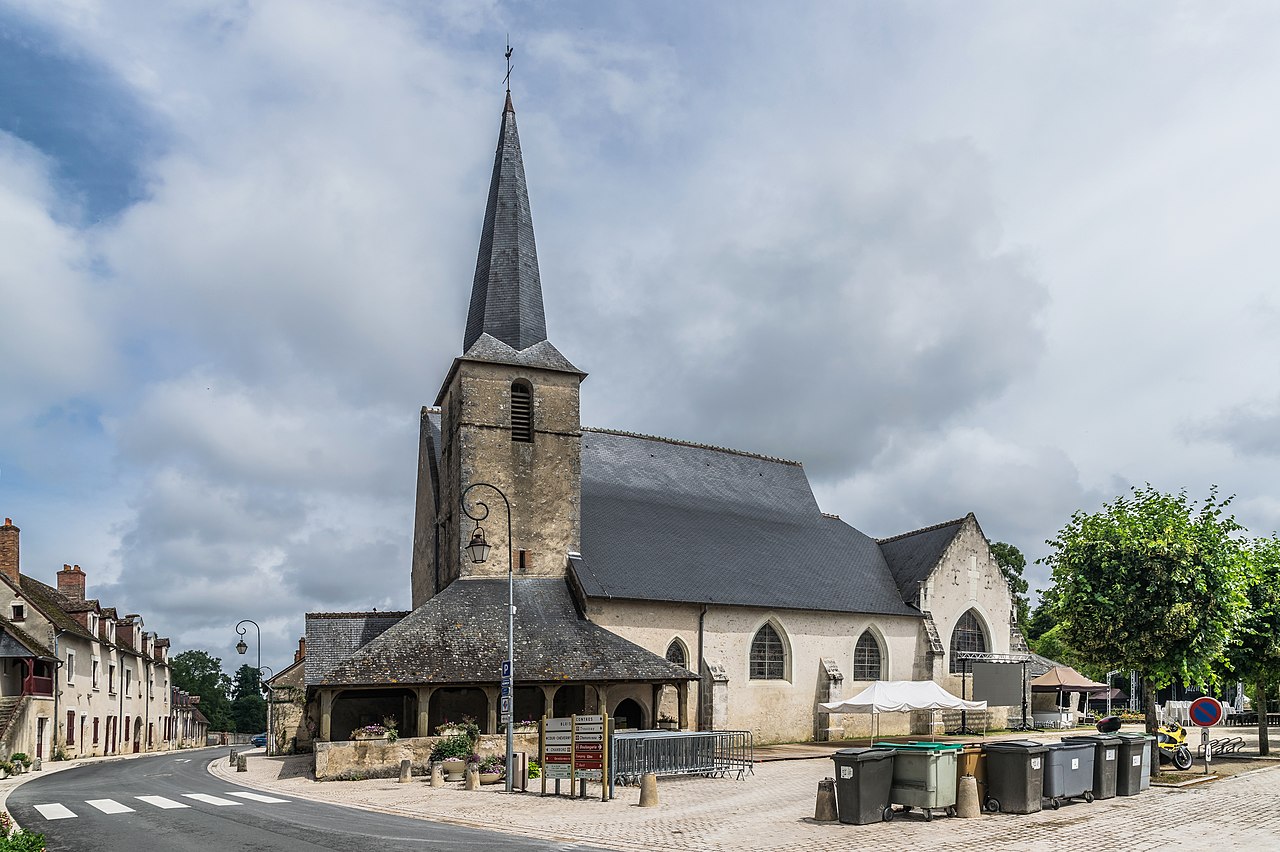
Cheverny

Rural municipality · 41700 · Centre-Val de Loire

👥 Population
910
2023 · INSEE
🏠 Median price /m²
3 950 €
📈 128% since 2015
💰 Gross yield
2.4 %
rent / purchase price
⚡ Avg. energy rating
C
✅ 0.0 % energy sieves (F-G) (F-G)
🎯 Investment score Low

Cheverny — Score 34/100.

Why this score? This score is penalized mainly by a weak rental yield (4/100) and improvable safety statistics (6/100).
34
💰 Yield4
🌳 Quality of life68
📊 Dynamism52
💸 Affordability9
🛡️ Safety6
⚡ Energy rating88
🧮 Simulate your rental yield

🏠 Property prices

DVF · 6 Transactions · Cheverny

🏢 Apt. /m²
3 950 €
🏡 House /m²
2 632 €
📋 Transactions
6
📈 Price per m² evolution (2020 — 2024)
📊 Annual transaction volume
📊 Nearby municipalities
CityApt.HouseTrans.Pop.
Blois1 982 €1 850 €68147 219
Romorantin-Lanthenay1 729 €1 485 €37018 373
Vendôme2 095 €1 909 €30915 758
Vineuil2 353 €2 318 €1048 064
Le Controis-en-Sologne3 200 €1 545 €1256 860
Mer1 387 €1 650 €766 250

💰 Rental yield

Calculated from DVF prices and observed rents

🏠 Average rent
7.97 €/m²
monthly
💰 Gross yield
2.4 %
⏳ Payback period
41.3 years

🏘️ Rental market & tension

INSEE Housing Stock 2021 · Pinel ABC zoning · Tense areas

🏠 Main residences
80.9 %
🏖️ Secondary homes
9.7 %
🚪 Vacant homes
9.4 %
🏢 Apartments
4.0 %
95.0 % houses
🎯 Pinel zoneOfficial Pinel zoning. A Bis = very high tension (Paris, French Riviera), A = high tension (metropolises), B1 = moderate, B2 = low, C = relaxed market.
B2
Low tension
⚖️ Tense area (ALUR law)Tense area under article 232 of the French Tax Code (CGI) / ALUR law. Enables rent control and applies the vacant housing tax.
No
Free rents
🏢 Social housing units
2
RPLS source

💶 Local taxation

REI · DGFIP · Exercice 2024

🏠 Property tax (built)Municipal property tax rate on built properties (TFB). Applied to the cadastral rental value to calculate the owner's annual property tax.
41.210 %
Global rate 2024
🌾 Property tax (unbuilt)Municipal property tax rate on unbuilt properties (TFNB): land, fields, forests.
83.790 %
🏘️ Housing tax
22.970 %
Secondary homes
🗑️ Waste collection taxTEOM — Household Waste Collection Tax. Applied by the municipality or intermunicipality to finance waste collection and treatment.
11.350 %
🌾 Land tax (unbuilt) REI
44.90 %

👥 Demographics

API Geo + INSEE

🧑‍🤝‍🧑 Inhabitants
910
2023
📐 Area
33.07 km²
28 inh/km²
💶 Median income
25 840 €
📊 Median age
50.9 yrs
25.4% under 30
💼 Activity rate
77.7 %
ages 15-64
📉 Unemployment rate
7.9 %
2021 census

🏢 Local economy & dynamism

SIRENE · INSEE

🏢 Active businesses
278
SIRENE database 2026
✨ 2024 creations
23
+130.0% vs 2023
📊 2023 creations
10
💼 Economic density
305
Businesses / 1,000 pop.

🚉 Transport & accessibility

SNCF Open Data · INSEE Urban Areas 2020

🚆 Nearest train station
Blois - Chambord
À 15.44 km · Segment A
🏙️ Urban attraction areaUrban Attraction Areas (INSEE 2020): municipal classification based on commuting relationships with urban hubs. Main hub / secondary / suburban crown / outside.
Blois
Suburban crown
🏛️ IntercommunalityEPCI — Public Establishment for Intermunicipal Cooperation. Community of communes, agglomeration, urban or metropolitan community grouping the municipality with its neighbors.
CA de Blois ''Agglopolys''
EPCI
📍 Rail access
Average
Station distance

🏥 Healthcare

FINESS

🏥 Établissements de santé
1

🏪 Amenities & services

BPE · INSEE

📋 Services_publics
13
📋 Commerce
6
🏥 Sante
11
⚽ Sport
7
🎭 Culture
4

🛡️ Safety

SSMSI · SSMSI · Ministry of the Interior

IndicatorIncidentsRate ‰Nat. averageGap
Vols dans les véhicules1112.10 ‰5.2 ‰+133 % vs moy.

⚡ Energy performance

2 DPE · ADEME

📊 Energy rating distribution
A
0.0 %
B
0.0 %
C
50.0 %
50.0 %
D
0.0 %
E
50.0 %
50.0 %
F
0.0 %
G
0.0 %

0.0 % energy sieves (F-G) (F+G) — Nat. average : 17 %

💶 Energy rating impact on price per m²

🏛️ Historical heritage

Mérimée database · 3 protected monuments

BuildingEra
château15e siècle;16e siècle;3e quart 19e siècle
château17e siècle;18e siècle
église12e siècle;16e siècle

⚠️ Natural and technological risks

Géorisques API · 6 risks identified

Feu de forêt
Mouvement de terrain
Par remontées de nappes naturelles
Tassements différentiels
Transport de marchandises dangereuses
Inondation

📡 Digital coverage

ARCEP

📶 Ultra-fast broadband
100.0 %

💧 Drinking water quality

API Hub'Eau · 2 208 analyses · CA AGGLOPOLYS (AEP)

⚗️ Physicochemistry
✅ Compliant
📋 analyses
2 208

⚡ EV charging stations

IRVE

🔌 Stations
5
⚡ Charge points
20
🚀 Incl. fast charging
4

🎯 Municipalities with a similar score

Same region, score close to

📍 Nearby municipalities

Nearest geographically

CityDistanceScorePop.
Cour-Cheverny 3.0 km 69/100 2 831
Cormeray 4.0 km 30/100 1 558
Fresnes 5.5 km 41/100 1 200
Mont-près-Chambord 8.5 km 34/100 3 386
Le Controis-en-Sologne 7.6 km 39/100 6 860
Fontaines-en-Sologne 6.8 km 47/100 661
Sassay 9.9 km 46/100 1 142
Cellettes 7.7 km 58/100 2 715

❓ Frequently asked questions about Cheverny

What is the price per m² in Cheverny?

The median price per m² in Cheverny is 3 950 €.

What is the rental yield in Cheverny?

The gross rental yield in Cheverny is 2.4%.

Is Cheverny a good real estate investment?

Cheverny has a ScorCity score of 34/100, making it a risky investment.

What is the average energy rating in Cheverny?

The most common energy rating class in Cheverny is C.

What are the natural risks in Cheverny?

6 risks are identified in Cheverny: Feu de forêt, Mouvement de terrain, Par remontées de nappes naturelles.