 Wikimedia Commons CC BY-SA
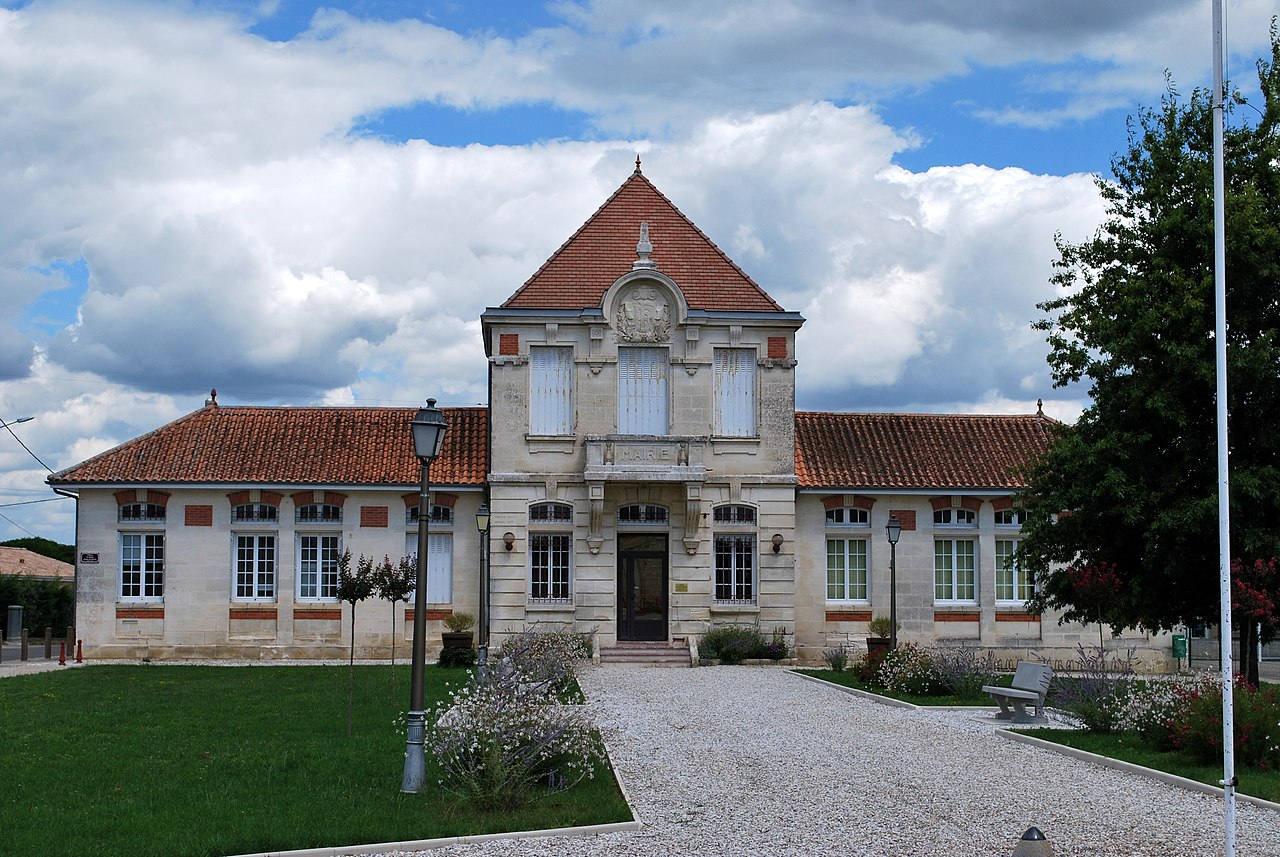
Saint-Genès-de-Fronsac
Rural municipality · 33240 · Nouvelle-Aquitaine
Saint-Genès-de-Fronsac — Score 44/100.
🏠 Property prices
DVF · 11 Transactions · Saint-Genès-de-Fronsac
| City | Apt. | House | Trans. | Pop. |
|---|---|---|---|---|
| Bordeaux | 4 423 € | 4 967 € | 4348 | 267 991 |
| Mérignac | 3 244 € | 4 209 € | 1067 | 78 090 |
| Pessac | 3 529 € | 4 000 € | 667 | 67 339 |
| Talence | 3 923 € | 4 458 € | 563 | 46 338 |
| Villenave-d'Ornon | 3 404 € | 3 519 € | 481 | 42 545 |
| Saint-Médard-en-Jalles | 3 636 € | 3 656 € | 345 | 32 910 |
💰 Rental yield
Calculated from DVF prices and observed rents
🏘️ Rental market & tension
INSEE Housing Stock 2021 · Pinel ABC zoning · Tense areas
💶 Local taxation
REI · DGFIP · Exercice 2024
👥 Demographics
API Geo + INSEE
🏢 Local economy & dynamism
SIRENE · INSEE
🚉 Transport & accessibility
SNCF Open Data · INSEE Urban Areas 2020
🏪 Amenities & services
BPE · INSEE
🛡️ Safety
SSMSI · SSMSI · Ministry of the Interior
| Indicator | Incidents | Rate ‰ | Nat. average | Gap |
|---|---|---|---|---|
| Escroqueries et fraudes aux moyens de paiement | 5 | 5.00 ‰ | 6.3 ‰ | -21 % vs moy. |
⚡ Energy performance
4 DPE · ADEME
0.0 % energy sieves (F-G) (F+G) — Nat. average : 17 %
🏛️ Historical heritage
Mérimée database · 1 protected monuments
| Building | Era |
|---|---|
| église | 12e siècle |
⚠️ Natural and technological risks
Géorisques API · 4 risks identified
📡 Digital coverage
ARCEP
💧 Drinking water quality
API Hub'Eau · 320 analyses · SO.GE.DO.
🎯 Municipalities with a similar score
Same region, score close to
📍 Nearby municipalities
Nearest geographically
| City | Distance | Score | Pop. |
|---|---|---|---|
| Périssac | 2.6 km | 38/100 | 1 184 |
| Vérac | 3.6 km | 49/100 | 883 |
| Marcenais | 4.1 km | 32/100 | 863 |
| Val de Virvée | 3.3 km | 44/100 | 3 793 |
| Marsas | 4.7 km | 40/100 | 1 247 |
| Gauriaguet | 4.3 km | 44/100 | 1 599 |
| La Lande-de-Fronsac | 5.2 km | 51/100 | 2 729 |
| Saint-Ciers-d'Abzac | 4.5 km | 54/100 | 1 614 |
❓ Frequently asked questions about Saint-Genès-de-Fronsac
What is the price per m² in Saint-Genès-de-Fronsac? ▶
The median price per m² in Saint-Genès-de-Fronsac is 2 318 €.
What is the rental yield in Saint-Genès-de-Fronsac? ▶
The gross rental yield in Saint-Genès-de-Fronsac is 5.8%.
Is Saint-Genès-de-Fronsac a good real estate investment? ▶
Saint-Genès-de-Fronsac has a ScorCity score of 44/100, making it a moderate investment.
What is the average energy rating in Saint-Genès-de-Fronsac? ▶
The most common energy rating class in Saint-Genès-de-Fronsac is C.
What are the natural risks in Saint-Genès-de-Fronsac? ▶
4 risks are identified in Saint-Genès-de-Fronsac: Mouvement de terrain, Tassements différentiels, Risque industriel.