 Wikimedia Commons CC BY-SA
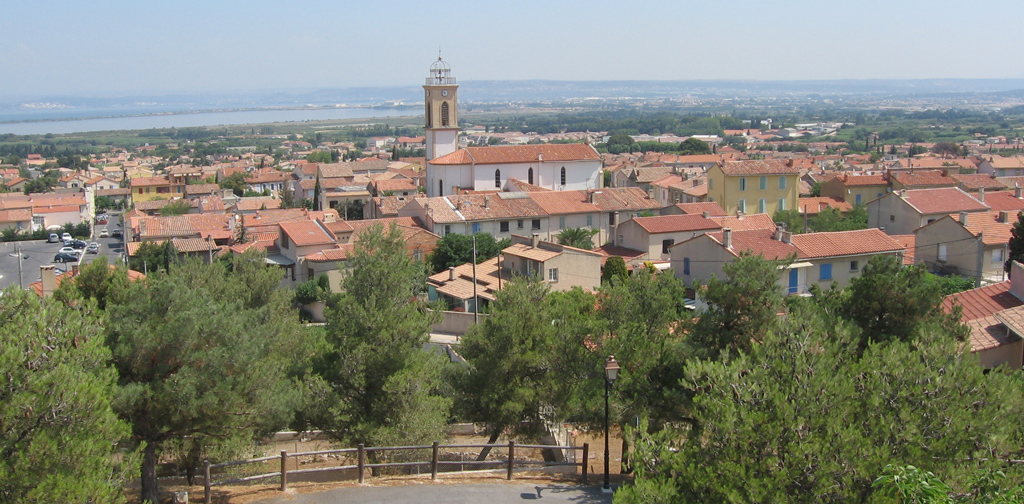
Châteauneuf-les-Martigues
Medium city · 13220 · Provence-Alpes-Côte d'Azur
Châteauneuf-les-Martigues — Score 52/100.
🏠 Property prices
DVF · 54 Transactions · Châteauneuf-les-Martigues
| City | Apt. | House | Trans. | Pop. |
|---|---|---|---|---|
| Marseille | 4 518 € | 4 691 € | 4239 | 886 040 |
| Aix-en-Provence | 4 925 € | 6 346 € | 2063 | 149 695 |
| Marseille 13e | 2 504 € | 4 241 € | 829 | 95 112 |
| Marseille 8e | 4 417 € | 7 700 € | 1288 | 84 683 |
| Marseille 15e | 1 500 € | 3 088 € | 569 | 79 161 |
| Marseille 9e | 3 028 € | 5 419 € | 956 | 77 406 |
💰 Rental yield
Calculated from DVF prices and observed rents
🏘️ Rental market & tension
INSEE Housing Stock 2021 · Pinel ABC zoning · Tense areas
💶 Local taxation
REI · DGFIP · Exercice 2024
👥 Demographics
API Geo + INSEE
🏢 Local economy & dynamism
SIRENE · INSEE
🚉 Transport & accessibility
SNCF Open Data · INSEE Urban Areas 2020
🎓 Education
National Education API
📊 Niveau social des établissements
Indicateur Éducation nationale du milieu social des élèves (moyenne nationale ≈ 103). Plus élevé = plus favorisé.
| Middle school | Sector | IPS |
|---|---|---|
| COLLEGE LES AMANDEIRETS | public | 95.4 |
🏥 Healthcare
BPE · FINESS
🏪 Amenities & services
BPE · INSEE
🛡️ Safety
SSMSI · SSMSI · Ministry of the Interior
| Indicator | Incidents | Rate ‰ | Nat. average | Gap |
|---|---|---|---|---|
| Escroqueries et fraudes aux moyens de paiement | 121 | 6.60 ‰ | 6.3 ‰ | Dans la moyenne |
| Destructions et dégradations volontaires | 105 | 5.70 ‰ | 7.2 ‰ | -21 % vs moy. |
| Vols sans violence contre des personnes | 95 | 5.10 ‰ | 7.3 ‰ | -30 % vs moy. |
| Violences physiques intrafamiliales | 67 | 3.60 ‰ | 4.2 ‰ | Dans la moyenne |
| Vols dans les véhicules | 48 | 2.60 ‰ | 5.2 ‰ | -50 % vs moy. |
| Cambriolages de logement | 45 | 5.80 ‰ | 7.5 ‰ | -23 % vs moy. |
| Vols de véhicule | 40 | 2.20 ‰ | 2.4 ‰ | Dans la moyenne |
| Vols d'accessoires sur véhicules | 31 | 1.70 ‰ | 3.7 ‰ | -54 % vs moy. |
| Violences physiques hors cadre familial | 27 | 1.50 ‰ | 4.0 ‰ | -62 % vs moy. |
| Violences sexuelles | 21 | 1.10 ‰ | 2.4 ‰ | -54 % vs moy. |
| Usage de stupéfiants | 19 | 1.00 ‰ | 8.4 ‰ | -88 % vs moy. |
| Usage de stupéfiants (AFD) | 13 | 0.70 ‰ | 7.5 ‰ | -91 % vs moy. |
| Vols violents sans arme | 5 | 0.30 ‰ | 1.0 ‰ | -70 % vs moy. |
⚡ Energy performance
22 DPE · ADEME
4.5 % energy sieves (F-G) (F+G) — Nat. average : 17 %
⚠️ Natural and technological risks
Géorisques API · 15 risks identified
📡 Digital coverage
ARCEP
💧 Drinking water quality
API Hub'Eau · 16 208 analyses · SOCIETE EAU DE MARSEILLE METROPOLE
⚡ EV charging stations
IRVE
🎯 Municipalities with a similar score
Same region, score close to
📍 Nearby municipalities
Nearest geographically
| City | Distance | Score | Pop. |
|---|---|---|---|
| Carry-le-Rouet | 5.0 km | 31/100 | 5 702 |
| Sausset-les-Pins | 5.4 km | 33/100 | 7 574 |
| Ensuès-la-Redonne | 5.1 km | 37/100 | 5 757 |
| Marignane | 6.8 km | 61/100 | 33 692 |
| Gignac-la-Nerthe | 7.0 km | 53/100 | 10 343 |
| Martigues | 8.2 km | 57/100 | 48 298 |
| Saint-Victoret | 8.8 km | 40/100 | 6 730 |
| Le Rove | 8.9 km | 40/100 | 5 246 |
❓ Frequently asked questions about Châteauneuf-les-Martigues
What is the price per m² in Châteauneuf-les-Martigues? ▶
The median price per m² in Châteauneuf-les-Martigues is 3 846 €.
What is the rental yield in Châteauneuf-les-Martigues? ▶
The gross rental yield in Châteauneuf-les-Martigues is 5.2%.
Is Châteauneuf-les-Martigues a good real estate investment? ▶
Châteauneuf-les-Martigues has a ScorCity score of 52/100, making it a moderate investment.
What is the average energy rating in Châteauneuf-les-Martigues? ▶
The most common energy rating class in Châteauneuf-les-Martigues is D.
What are the natural risks in Châteauneuf-les-Martigues? ▶
15 risks are identified in Châteauneuf-les-Martigues: Affaissements et effondrements d'origine anthropique (anciennes carrières souterraines, hors mines), Eboulement ou chutes de pierres et de blocs, Effet de surpression.