 Wikimedia Commons CC BY-SA
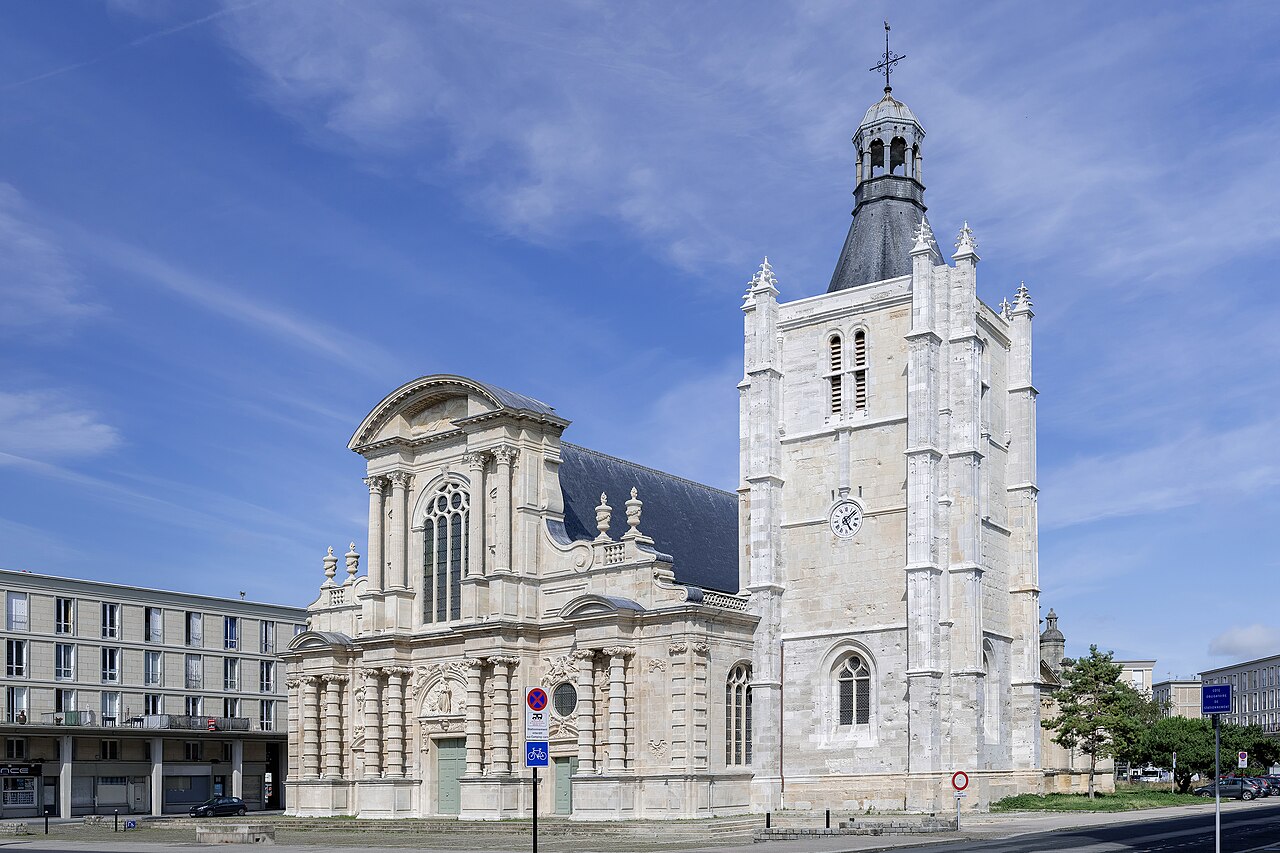
Le Havre
Metropolis · 76600 · Normandie
Le Havre — Score 54/100.
🏠 Property prices
DVF · 1 940 Transactions · Le Havre
| City | Apt. | House | Trans. | Pop. |
|---|---|---|---|---|
| Le Havre | 2 565 € | 2 381 € | 2644 | 166 687 |
| Rouen | 2 962 € | 2 904 € | 2466 | 117 662 |
| Saint-Étienne-du-Rouvray | 1 127 € | 2 030 € | 242 | 29 518 |
| Sotteville-lès-Rouen | 2 000 € | 2 292 € | 376 | 29 003 |
| Dieppe | 2 636 € | 2 215 € | 661 | 28 496 |
| Le Grand-Quevilly | 2 160 € | 2 633 € | 149 | 25 789 |
💰 Rental yield
Calculated from DVF prices and observed rents
🏘️ Rental market & tension
INSEE Housing Stock 2021 · Pinel ABC zoning · Tense areas
💶 Local taxation
REI · DGFIP · Exercice 2024
👥 Demographics
API Geo + INSEE
🏢 Local economy & dynamism
SIRENE · INSEE
🚉 Transport & accessibility
SNCF Open Data · INSEE Urban Areas 2020
🎓 Education
National Education API
| High school | Type | Pass rate | Honors | V.A. |
|---|---|---|---|---|
| LYCEE SAINT VINCENT DE PAUL (GENERAL ET TECHNO.) | privé sous contrat | 100.0 % | — | +2.0 |
| LYCEE FRANCOISE DE GRACE (GENERAL ET TECHNO.) | public | 100.0 % | — | +11.0 |
| LYCEE JULES LE CESNE (GENERAL ET TECHNO.) | public | 100.0 % | — | +2.0 |
| LYCEE SAINT JOSEPH | privé sous contrat | 99.0 % | — | +0.0 |
| LYCEE FRANCOIS 1ER | public | 96.0 % | — | -1.0 |
| LYCEE CLAUDE MONET | public | 94.0 % | — | +1.0 |
| LYCEE JULES SIEGFRIED | public | 93.0 % | — | -3.0 |
| LYCEE SCHUMAN-PERRET (GENERAL ET TECHNO.) | public | 82.0 % | — | -9.0 |
| LYCEE PORTE OCEANE (GENERAL ET TECHNO.) | public | 77.0 % | — | -8.0 |
📊 Niveau social des établissements
Indicateur Éducation nationale du milieu social des élèves (moyenne nationale ≈ 103). Plus élevé = plus favorisé.
| Middle school | Sector | IPS |
|---|---|---|
| COLLEGE PRIVE SAINT JOSEPH | privé sous contrat | 125.3 |
| COLLEGE PRIVE LES ORMEAUX | privé sous contrat | 124.2 |
| COLLEGE RAOUL DUFY | public | 118.5 |
| COLLEGE LES ACACIAS | public | 95.9 |
| COLLEGE IRENE JOLIOT CURIE | public | 95.1 |
| COLLEGE PRIVE SACRE COEUR | privé sous contrat | 93.3 |
| COLLEGE ROMAIN ROLLAND | public | 86.2 |
| COLLEGE PRIVE MONTESQUIEU SAINTE MARIE | privé sous contrat | 85.4 |
| COLLEGE CLAUDE BERNARD | public | 81.1 |
| COLLEGE THEOPHILE GAUTIER | public | 81.0 |
| COLLEGE JULES VALLES | public | 78.6 |
| COLLEGE LEO LAGRANGE | public | 74.9 |
| COLLEGE JEAN MOULIN | public | 74.7 |
| COLLEGE GERARD PHILIPE | public | 74.7 |
| COLLEGE HENRI WALLON | public | 72.4 |
| COLLEGE JACQUES MONOD | public | 69.2 |
| COLLEGE DESCARTES | public | 67.5 |
| COLLEGE EUGENE VARLIN | public | 67.0 |
| COLLEGE MARCEL PAGNOL | public | 63.5 |
🏥 Healthcare
BPE · FINESS
🏪 Amenities & services
BPE · INSEE
🏛️ Public services
Public Service Directory API · 13 services
| Category | Qty | Examples |
|---|---|---|
| 📋 service public | 11 | Point d'information local dédié aux personnes âgées - Le Havre, Tribunal judiciaire du Havre, Cap emploi - Seine-Maritime - Le Havre |
| 📋 Ordre professionnel | 1 | Ordre des avocats - Barreau du Havre |
| 📋 Service déconcentré | 1 | Direction régionale des douanes - Le Havre |
🛡️ Safety
SSMSI · SSMSI · Ministry of the Interior
| Indicator | Incidents | Rate ‰ | Nat. average | Gap |
|---|---|---|---|---|
| Usage de stupéfiants | 1 773 | 10.60 ‰ | 8.4 ‰ | +26 % vs moy. |
| Destructions et dégradations volontaires | 1 733 | 10.40 ‰ | 7.2 ‰ | +44 % vs moy. |
| Vols sans violence contre des personnes | 1 700 | 10.20 ‰ | 7.3 ‰ | +40 % vs moy. |
| Usage de stupéfiants (AFD) | 1 442 | 8.70 ‰ | 7.5 ‰ | +16 % vs moy. |
| Escroqueries et fraudes aux moyens de paiement | 1 166 | 7.00 ‰ | 6.3 ‰ | Dans la moyenne |
| Violences physiques hors cadre familial | 861 | 5.20 ‰ | 4.0 ‰ | +30 % vs moy. |
| Violences physiques intrafamiliales | 824 | 4.90 ‰ | 4.2 ‰ | +17 % vs moy. |
| Cambriolages de logement | 532 | 5.60 ‰ | 7.5 ‰ | -25 % vs moy. |
| Vols dans les véhicules | 465 | 2.80 ‰ | 5.2 ‰ | -46 % vs moy. |
| Violences sexuelles | 418 | 2.50 ‰ | 2.4 ‰ | Dans la moyenne |
| Vols de véhicule | 289 | 1.70 ‰ | 2.4 ‰ | -29 % vs moy. |
| Trafic de stupéfiants | 192 | 1.20 ‰ | 2.2 ‰ | -45 % vs moy. |
| Vols d'accessoires sur véhicules | 157 | 0.90 ‰ | 3.7 ‰ | -76 % vs moy. |
| Vols violents sans arme | 148 | 0.90 ‰ | 1.0 ‰ | Dans la moyenne |
| Vols avec armes | 20 | 0.10 ‰ | 0.6 ‰ | -83 % vs moy. |
⚡ Energy performance
1 409 DPE · ADEME
12.7 % energy sieves (F-G) (F+G) — Nat. average : 17 %
🏛️ Historical heritage
Mérimée database · 31 protected monuments
| Building | Era |
|---|---|
| immeuble | 16e siècle;17e siècle |
| immeuble | — |
| immeuble | 16e siècle;17e siècle |
| immeuble | 16e siècle;17e siècle |
| immeuble | 16e siècle;17e siècle |
| château | 4e quart 19e siècle |
| monument commémoratif | — |
| immeuble | 1er quart 20e siècle |
| église paroissiale | 3e quart 20e siècle |
| maison | 16e siècle;17e siècle |
⚠️ Natural and technological risks
Géorisques API · 7 risks identified
📡 Digital coverage
ARCEP
💧 Drinking water quality
API Hub'Eau · 88 976 analyses · MAIRIE DU HAVRE
⚡ EV charging stations
IRVE
🎯 Municipalities with a similar score
Same region, score close to
📍 Nearby municipalities
Nearest geographically
| City | Distance | Score | Pop. |
|---|---|---|---|
| Fontaine-la-Mallet | 5.1 km | 50/100 | 2 725 |
| Sainte-Adresse | 4.1 km | 38/100 | 7 004 |
| Octeville-sur-Mer | 7.1 km | 45/100 | 6 172 |
| Harfleur | 5.1 km | 47/100 | 8 289 |
| Montivilliers | 6.9 km | 54/100 | 15 478 |
| Fontenay | 8.8 km | 32/100 | 1 766 |
| Gonfreville-l'Orcher | 6.7 km | 44/100 | 8 916 |
| Cauville-sur-Mer | 11.0 km | 35/100 | 1 678 |
❓ Frequently asked questions about Le Havre
What is the price per m² in Le Havre? ▶
The median price per m² in Le Havre is 2 565 €.
What is the rental yield in Le Havre? ▶
The gross rental yield in Le Havre is 5.8%.
Is Le Havre a good real estate investment? ▶
Le Havre has a ScorCity score of 54/100, making it a moderate investment.
What is the average energy rating in Le Havre? ▶
The most common energy rating class in Le Havre is D.
What are the natural risks in Le Havre? ▶
7 risks are identified in Le Havre: Par submersion marine, Recul du trait de côte et de falaises, Transport de marchandises dangereuses.