View of Espère, 46 — real-estate investment analysis Wikimedia Commons CC BY-SA
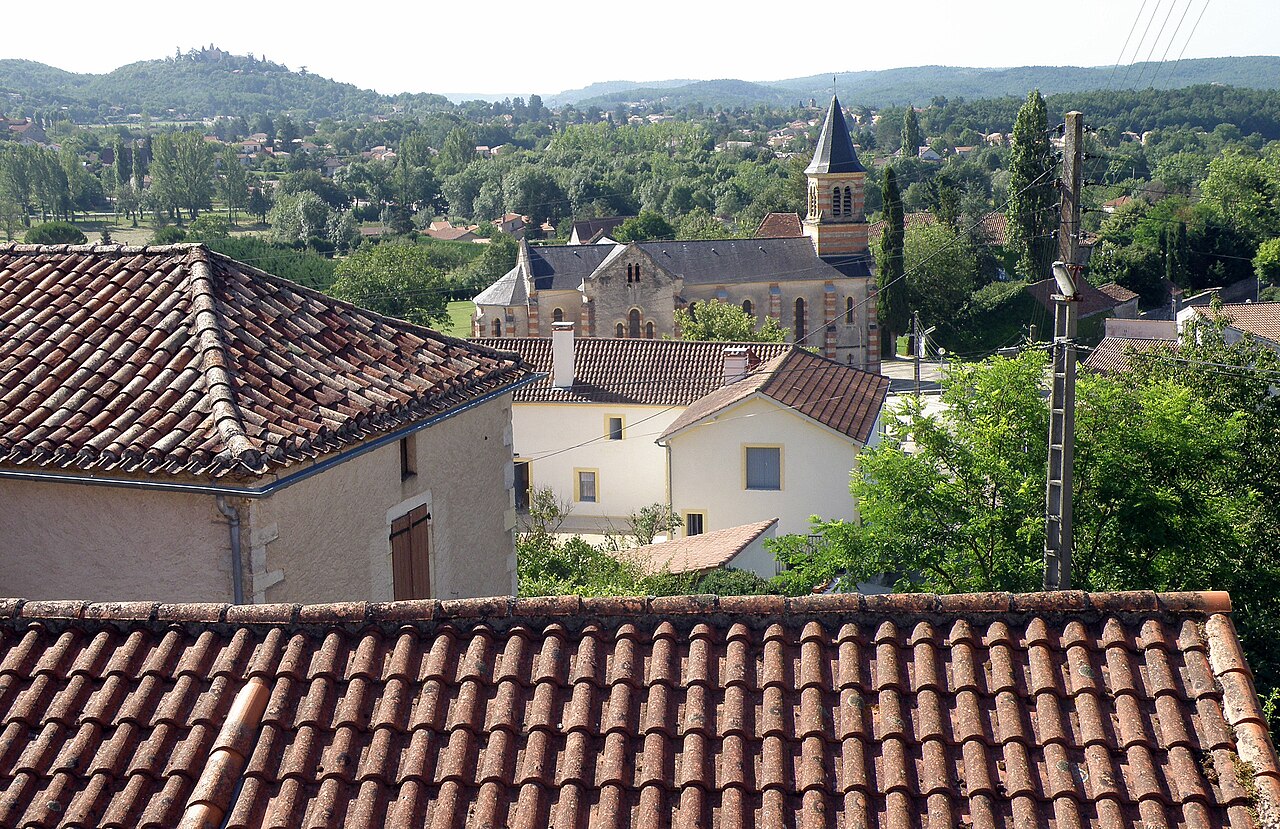
Espère

Rural municipality · 46090 · Occitanie

👥 Population
963
2023 · INSEE
🏠 Median price /m²
2 800 €
📈 70% since 2015
💰 Gross yield
3.9 %
rent / purchase price
⚡ Avg. energy rating
E
✅ 8.6 % energy sieves (F-G) (F-G)
🎯 Investment score Average

Espère — Score 53/100.

53
💰 Yield45
🌳 Quality of life81
📊 Dynamism51
💸 Affordability56
🛡️ Safety11
⚡ Energy rating80
🧮 Simulate your rental yield

🏠 Property prices

DVF · 2 Transactions · Espère

🏢 Apt. /m²
2 800 €
🏡 House /m²
1 712 €
📋 Transactions
2
📈 Price per m² evolution (2020 — 2024)
📊 Annual transaction volume
📊 Nearby municipalities
CityApt.HouseTrans.Pop.
Cahors1 807 €1 883 €46220 050
Figeac1 823 €1 748 €2019 793
Gourdon1 465 €1 542 €1044 206
Pradines1 985 €2 072 €573 617
Gramat1 455 €1 746 €733 512
Saint-Céré2 800 €1 407 €643 429

💰 Rental yield

Calculated from DVF prices and observed rents

🏠 Average rent
9.05 €/m²
monthly
💰 Gross yield
3.9 %
⏳ Payback period
25.8 years

🏘️ Rental market & tension

INSEE Housing Stock 2021 · Pinel ABC zoning · Tense areas

🏠 Main residences
92.8 %
🏖️ Secondary homes
2.5 %
🚪 Vacant homes
4.8 %
🏢 Apartments
8.4 %
91.4 % houses
🎯 Pinel zoneOfficial Pinel zoning. A Bis = very high tension (Paris, French Riviera), A = high tension (metropolises), B1 = moderate, B2 = low, C = relaxed market.
C
Relaxed market
⚖️ Tense area (ALUR law)Tense area under article 232 of the French Tax Code (CGI) / ALUR law. Enables rent control and applies the vacant housing tax.
No
Free rents
🏢 Social housing units
37
RPLS source

💶 Local taxation

REI · DGFIP · Exercice 2024

🏠 Property tax (built)Municipal property tax rate on built properties (TFB). Applied to the cadastral rental value to calculate the owner's annual property tax.
52.450 %
Global rate 2024
🌾 Property tax (unbuilt)Municipal property tax rate on unbuilt properties (TFNB): land, fields, forests.
364.100 %
🏘️ Housing tax
20.680 %
Secondary homes
🗑️ Waste collection taxTEOM — Household Waste Collection Tax. Applied by the municipality or intermunicipality to finance waste collection and treatment.
12.990 %
🌾 Land tax (unbuilt) REI
3.53 %

👥 Demographics

API Geo + INSEE

🧑‍🤝‍🧑 Inhabitants
963
2023
📐 Area
6.26 km²
154 inh/km²
💶 Median income
22 500 €
📊 Median age
47.6 yrs
30.3% under 30
💼 Activity rate
76.1 %
ages 15-64
📉 Unemployment rate
10.2 %
2021 census

🏢 Local economy & dynamism

SIRENE · INSEE

🏢 Active businesses
170
SIRENE database 2026
✨ 2024 creations
16
+100.0% vs 2023
📊 2023 creations
8
💼 Economic density
177
Businesses / 1,000 pop.

🚉 Transport & accessibility

SNCF Open Data · INSEE Urban Areas 2020

🚆 Nearest train station
Cahors
À 8.64 km · Segment B
🏙️ Urban attraction areaUrban Attraction Areas (INSEE 2020): municipal classification based on commuting relationships with urban hubs. Main hub / secondary / suburban crown / outside.
Cahors
Suburban crown
🏛️ IntercommunalityEPCI — Public Establishment for Intermunicipal Cooperation. Community of communes, agglomeration, urban or metropolitan community grouping the municipality with its neighbors.
CA du Grand Cahors
EPCI
📍 Rail access
Good
Station distance

🏥 Healthcare

FINESS

🏥 Établissements de santé
2

🏪 Amenities & services

BPE · INSEE

📋 Services_publics
19
📋 Commerce
5
📋 Enseignement
1
🏥 Sante
14
⚽ Sport
9

🛡️ Safety

SSMSI · SSMSI · Ministry of the Interior

IndicatorIncidentsRate ‰Nat. averageGap
Destructions et dégradations volontaires66.20 ‰7.2 ‰Dans la moyenne

⚡ Energy performance

35 DPE · ADEME

📊 Energy rating distribution
A
8.6 %
8.6 %
B
14.3 %
14.3 %
C
20.0 %
20.0 %
D
22.9 %
22.9 %
E
25.7 %
25.7 %
F
5.7 %
G
2.9 %

8.6 % energy sieves (F-G) (F+G) — Nat. average : 17 %

💶 Energy rating impact on price per m²

⚠️ Natural and technological risks

Géorisques API · 8 risks identified

Affaissements et effondrements d'origine anthropique (anciennes carrières souterraines, hors mines)
Eboulement ou chutes de pierres et de blocs
Feu de forêt
Glissement de terrain
Mouvement de terrain
Rupture de barrage
Tassements différentiels
Transport de marchandises dangereuses

📡 Digital coverage

ARCEP

📶 Ultra-fast broadband
100.0 %

💧 Drinking water quality

API Hub'Eau · 1 258 analyses · COMMUNAUTE D'AGGLO DU GRAND CAHORS

⚗️ Physicochemistry
✅ Compliant
📋 analyses
1 258

🎯 Municipalities with a similar score

Same region, score close to

📍 Nearby municipalities

Nearest geographically

CityDistanceScorePop.
Mercuès 2.3 km 60/100 1 122
Caillac 3.1 km 56/100 581
Crayssac 3.5 km 48/100 844
Douelle 4.8 km 48/100 830
Pradines 5.6 km 56/100 3 617
Catus 5.8 km 53/100 921
Cahors 8.3 km 64/100 20 050
Trespoux-Rassiels 9.8 km 44/100 845

❓ Frequently asked questions about Espère

What is the price per m² in Espère?

The median price per m² in Espère is 2 800 €.

What is the rental yield in Espère?

The gross rental yield in Espère is 3.9%.

Is Espère a good real estate investment?

Espère has a ScorCity score of 53/100, making it a moderate investment.

What is the average energy rating in Espère?

The most common energy rating class in Espère is E.

What are the natural risks in Espère?

8 risks are identified in Espère: Affaissements et effondrements d'origine anthropique (anciennes carrières souterraines, hors mines), Eboulement ou chutes de pierres et de blocs, Feu de forêt.